
Search Exchange
Search All Sites
Nagios Live Webinars
Let our experts show you how Nagios can help your organization.Login
 New Listings
Directory Tree
Directory
preocupao
Interfacetable_v3t
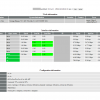 Interfacetable_v3t.pl is a Nagios(R) plugin that allows you to monitor the network interfaces of a node (e.g. router, switch, server) without knowing each interface in detail. This plugin comes from check_interface_table.pl / check_interface_table_v2.pl, ...
check_iftraffic64
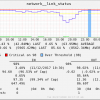 Bug and feature update to check_iftraffic3. This is a 64 (and 32) bit Nagvis compatible SNMP iftraffic check. Renamed to highlight the change from 32 to 64 bit as the default counters used. Tested with Windows 2003/08/12, Linux (RedHat), and Cisco devi ...
check_traffic_pnp4naios
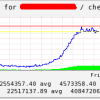 this shell is check for pnp4nagios's Flow chart .
Check interface bandwidth
Plugin for monitoring utilization of network interfaces linux and cisco. Compatible with nagvis and pnp4nagios.
MacNagios
Nagios status bar monitoring tool for MacOS X. Have you ever wished that you could just look at the top right corner of your Mac desktop and see a little icon and a number that indicated how your servers were doing? And if something went wrong, get a l ...
PushMon
PushMon is monitoring a push model. A client daemon runs a set or nagios plugins every interval. These results are all pushed to a webserver using POST requests. With the config builder and nagios checks included you can dynamically generate a nagios con ...


