Search Exchange
Search All Sites
Nagios Live Webinars
Let our experts show you how Nagios can help your organization.Login
Directory Tree
Directory
Most Favoured Listings
Meet The New Nagios Core Services Platform
Built on over 25 years of monitoring experience, the Nagios Core Services Platform provides insightful monitoring dashboards, time-saving monitoring wizards, and unmatched ease of use. Use it for free indefinitely.
Monitoring Made Magically Better
- Nagios Core on Overdrive
- Powerful Monitoring Dashboards
- Time-Saving Configuration Wizards
- Open Source Powered Monitoring On Steroids
- And So Much More!
Submit Your Nagios Project!
Help build Nagios Exchange for yourself and the entire the Nagios Community by your Nagios project to the site. It's easy - just create an account, login, and add a new listing. Read the FAQ for instructions.check_linux_stats Featured
 Plugin to check linux system performance (cpu, mem, load, disk usage, disk io, network usage, open files and processes).
A perl plugin using Sys::Statistics::Linux
Thanks to Jonny Schulz, the author of Sys::Statistics::Linux, for his great work (ht ...
exfoliation Featured Popular
 Exfoliation is a simple makeover for the Nagios Core web interface. It consists of two folders that overlay on a stock Nagios installation.
nagiosgraph Featured
 nagiosgraph parses output and performance data from Nagios plugins, and stores the data in RRD files. nagiosgraph displays data in Nagios trends, as popups for hosts and services, or in separate reports. Easy to set up but eminently customizable.
Nagios V-Shell Featured Popular
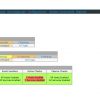 Nagios V-Shell is a PHP web interface to Nagios Core that is designed to be lightweight, easy to install and use, and customizable. As of v1.7, V-Shell now has gettext support for internationalization.
Version 1.9 has now been overhauled for substant ...
check_esxi_hardware.py
![]() check_esxi_hardware (formerly known as check_esx_wbem) is an open source monitoring plugin to monitor the hardware of ESXi (and previously ESX) servers. It queries the CIM (Common Information Model) server running on the ESXi server to retrieve the curren ...
check_esxi_hardware (formerly known as check_esx_wbem) is an open source monitoring plugin to monitor the hardware of ESXi (and previously ESX) servers. It queries the CIM (Common Information Model) server running on the ESXi server to retrieve the curren ...
SNMP Printer Check Popular
![]() Universal printer check. Check for specific consumables or report on all. Query model/serial #, event messages, tray status and much more!
Originally based on Monitoring Solutions' check_snmp_printer, this provides friendly output, quick execution and ...
Universal printer check. Check for specific consumables or report on all. Query model/serial #, event messages, tray status and much more!
Originally based on Monitoring Solutions' check_snmp_printer, this provides friendly output, quick execution and ...
check_oracle_health
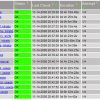 check_oracle_health is a plugin for the Nagios monitoring software that allows you to monitor various metrics of an Oracle database. It includes connection time, SGA data buffer hit ratio, SGA library cache hit ratio, SGA dictionary cache hit ratio, SGA s ...
check_multi
 check_multi is a multi purpose swiss knife plugin.
It calls multiple child plugins and displays their output in the long_plugin_output. A summary is given in the standard plugin output. The child return code with the highest severity becomes the parent ...
NRPE - Nagios Remote Plugin Executor Featured Popular
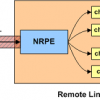 NRPE allows you to remotely execute Nagios plugins on other Linux/Unix machines. This allows you to monitor remote machine metrics (disk usage, CPU load, etc.). NRPE can also communicate with some of the Windows agent addons, so you can execute scripts an ...
check_mysql_health
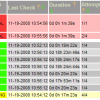 check_mysql_health is a plugin for Nagios that allows you to monitor a MySQL database. Among the list of metrics are time to login, index usage, bufferpool hit rate, query cache hit rate, slow queries, temp tables on disk, table cache hit rate, connected ...
check_ilo2_health
Check hardware health of HP Proliant Servers by querying the iLO2/3/4/5 Management Controller.
PNP4Nagios
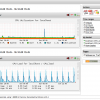 PNP is an addon to Nagios which analyzes performance data provided by plugins and stores them automatically into RRD-databases (Round Robin Databases, see RRD Tool).
Vmware ESX & VM host
Excellent plugin developed by OP5. Work with ESX4, vSephere. Entire DC can be monitored by quering through vCenter... sage: esx_cpu.pl -D | -H [ -N ] -u -p | -f -l [ -s ] [ -x ] [ -t ] [ -w ] [ -c ] [ -V ] [ - ...
Mod Gearman
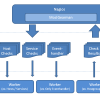 Distribute Hostchecks, Servicechecks and Eventhandler with Gearman. Replace distributed Nagios installations with Gearman worker for easy high availability. Host/Servicegroup affinity included.
check_logfiles
check_logfiles is used to scan the lines of a file for regular expressions.
Synology status
 this plugin check the health of your Synology NAS
- System status (Power, Fans)
- Disks status
- RAID (Volume) status
- DSM update status
- Temperatures
- Storage percentage of use
- UPS informations
check_mssql_health Popular
 check_mssql_health is a plugin which checks several metrics of MS SQL Server.
NDOUtils Featured
 NDOUtils allows you to export current and historical data from one or more Nagios instances to a MySQL database. Several community addons use this as one of their data sources. NDOUtils consists of a standalone daemon, a Nagios event broker, and several ...
Active Directory (AD) Check
Wrapper for dcdiag.exe for Active Directory monitoring written in VBS. This is a re-work of a script originally found here: http://felipeferreira.net/?p=315&cpage=1#comments Only tested with Nagios 3.2.3. It should work on any version which supports ...
check_vmware_api
check_vmware_api (former check_esx3) is a Nagios plugin made by op5 AB to monitor vmware's products. The plugin uses the VMWare API (via HTTPS) to do a wide variety of checks. You can check out the latest version with GIT at git://git.op5.org/nagios/op ...

 Directory
 New Listings