Search Exchange
Search All Sites
Nagios Live Webinars
Let our experts show you how Nagios can help your organization.Login
Directory Tree
Category: Graphing and Trending
Graphing and trending utilities/addons for Nagios.
Meet The New Nagios Core Services Platform
Built on over 25 years of monitoring experience, the Nagios Core Services Platform provides insightful monitoring dashboards, time-saving monitoring wizards, and unmatched ease of use. Use it for free indefinitely.
Monitoring Made Magically Better
- Nagios Core on Overdrive
- Powerful Monitoring Dashboards
- Time-Saving Configuration Wizards
- Open Source Powered Monitoring On Steroids
- And So Much More!
Submit Your Nagios Project!
Help build Nagios Exchange for yourself and the entire the Nagios Community by your Nagios project to the site. It's easy - just create an account, login, and add a new listing. Read the FAQ for instructions.n2rrd Featured
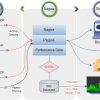 N2RRD (Nagios to Round Robin Database) is a Nagios add-on tool, which stores performance data generated by Nagios plugins into an Round-Robin-Database (see RRDtool). The package also includes the display tool rrd2graph to view data stored in an RRD databa ...
nagiosgraph Featured
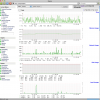 nagiosgraph parses output and performance data from Nagios plugins, and stores the data in RRD files. nagiosgraph displays data in Nagios trends, as popups for hosts and services, or in separate reports. Easy to set up but eminently customizable.
APAN
 Apan, Advanced Performance Addon for Nagios is a tool for integrating Nagios with RRD-tool. The purpose is to make it easy to collect statistics from different service-checks in Nagios and to view it graphically via a web-interface.
APANgen
APANgen is a script to help add APAN-enabled services quickly to an existing Nagios installation. Currently APANgen can add ping, nt-disk, and unix disk checks.
BrainyPDM - Performance Data Management
 BrainyPDM (a.k.a. Brainy Performance Data Management) is an open source system performance data management and monitoring tool. It gathers performance data from Nagios for make automatic graph, custom graphs (in the next release), reports (in the next rel ...
c2n - Cacti to Nagios
c2n.cgi is a filter/wrapper for the frontend of Cacti to include it in Nagios. I will not do any further development of this wrapper because I have migrated to pnp4nagios Martin Fuerstenau
fifo-rrd
fifo-rrd takes the performance data provided by the Nagios plugins and create and/or updates RRD databases used to display performance trend graphs by the rrd-graph project.
graphios
Graphios is a program to send nagios perf data to graphite (carbon).
Highcharts for Nagios
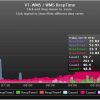 Highcharts for Nagios offering good-looking interactive charts to you.
Zooming can be in the X or Y dimension, or both.
It can show/hide different data series and auto adjust X, Y axis.
You can directly export the chart to PNG, JPG, PDF or SVG format.
Metricinga
Metricinga is a gevent-based daemon for forwarding Nagios performance data to Graphite.
mypan
mypan (MY Performance Add-on for Nagios) is as the name states an add-on for Nagios. The goal is to provide an easy way to graph performance data retrieved from Nagios using rrdtool.
Nagios External Perfdata Processor
An external performance processing tool used to wrap standard scripts.
nagios python parser
 http://d1b.github.com/nagios_python_parser/
This is a small python nagios parser. It is licensed under the gpl v2.
It is currently in testing and probably has bugs ^^.
TODO:
html output
XXX: check nagios documentation for output and required st ...
Nagios to Graph (n2graph)
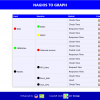 Tool to graph nagios's performance data
It collects in background performance data from nagios's log files and stores it in a mysql database. Then a web interface shows that data in graphs.
nagios2cacti
Nagios 2 Cacti, N2Cacti, is a project derived from N2RRD. N2cacti will parse Nagios Configuration, read N2RRD configuration (modified version homemade) and will configure Cacti to create a Graph by Nagios Services.
nagiostat
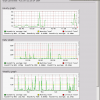 Nagiostat parses performance-data from Nagios and generates graphs of trends over time. Nagiostat makes use of RRD-tool. It then generates graphs on-the-fly through a CGI-script and HTML-templates. Nagiostat is written in perl.
ndo2db grapher
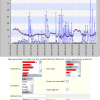 ndo2db grapher aim is to provide a quick way to retrieve informations in realtime against nagios values without external tools like RRD. To achieve this, I'm using ndoutils tool set which let you store performance data in a database.
opcp
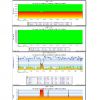 OpCP is a capacity planning graph generator based on opdb ( nagios broker ) database.
perf2rrd
perf2rrd is a Java utility that will automate the extraction of performance data from Nagios plugins into round robin database files (.rrd's).
PerfData
Various Perl scripts that can be used to automate graph generation.
Performance History Graphs for Nagios with Nagiosgraph
Nagiosgraph is our most important extension to the monitoring system. There are several packages available for Nagios graphing, but at the time of implementation in 2008 the Nagiosgraph package was a lucky choice. Today we have more then 3740 service grap ...
PerfParse
 PerfParse facilitates the storage and analysis of binary performance data produced by Nagios and produces high-quality accurate graphs of live data from standard Nagios plugins. A permanent history of plugin results can then be viewed with advanced analys ...
Plotly4Nagios
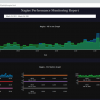 Plotly4Nagios is a nagios plugin to display the performance data in Graph. It uses the RRD database provided by pnp4nagios and visualize it in interactive graph format using plotly javascript framework.
PNP4Nagios
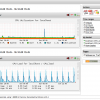 PNP is an addon to Nagios which analyzes performance data provided by plugins and stores them automatically into RRD-databases (Round Robin Databases, see RRD Tool).
rrd-graph
rrd-graph is a Perl script which shares a common configuration scheme with fifo-rrd. rrd-graph will read the fifo-rrd configuration, along with it's own configuration to create graphs from the data stored in RRDs by fifo-rrd.
rrd-mdgraph
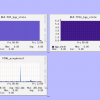 rrd-mdgraph draws group of graphs (by default) of all services for host and display it on HTML page.
SmiStat
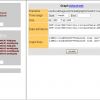 Smistat is a set of CGI-Perl scripts used to generate RRDTool graphs using performance data provided by Nagios plugins. It includes a web-based graph wizard for those who are not experienced with RRDtool.
Statusengine
 Statusengine is a project to process and store event data collected by Nagios. Statusengine will save all monitoring data to MySQL, CrateDB or Redis. It also has an inbuild performance data processor, which is able to save perfdata to Graphite, CrateDB, E ...


 New Listings