Search Exchange
Search All Sites
Nagios Live Webinars
Let our experts show you how Nagios can help your organization.Login
Directory Tree
Alert Cloud XI Component
Compatible With
- Nagios XI
Owner
Hits
98194
Meet The New Nagios Core Services Platform
Built on over 25 years of monitoring experience, the Nagios Core Services Platform provides insightful monitoring dashboards, time-saving monitoring wizards, and unmatched ease of use. Use it for free indefinitely.
Monitoring Made Magically Better
- Nagios Core on Overdrive
- Powerful Monitoring Dashboards
- Time-Saving Configuration Wizards
- Open Source Powered Monitoring On Steroids
- And So Much More!
Reviews (3)
byAtomrail, June 13, 2014
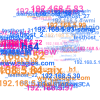
This is a neat idea the only problem is that if you have a lot of nodes in your environment it's just a jumbled mass of worms in a cup.
Is there a way to have the ability to select what you want to see. For example if I want to only see systems that are down or have a service issue, that would be a lot less than seeing 500 plus nodes that are working fine.
Is there a way to have the ability to select what you want to see. For example if I want to only see systems that are down or have a service issue, that would be a lot less than seeing 500 plus nodes that are working fine.
The bug in xmldata.php is fixed.
Korrax, thank you for pointing this out!
Korrax, thank you for pointing this out!
byKorrax, September 18, 2011
This Component is realy nice.
But there is a bug in the xmldata.php.
In line 81 the variable $hostname must be called $lasthost to show the right host at this point.
echo '.$lasthost.';
But there is a bug in the xmldata.php.
In line 81 the variable $hostname must be called $lasthost to show the right host at this point.
echo '.$lasthost.';


 New Listings
