Search Exchange
Search All Sites
Nagios Live Webinars
Let our experts show you how Nagios can help your organization.Login
Directory Tree
Nagios Dash
Current Version
0.0.1-alpha666
Last Release Date
2009-11-12
Compatible With
- Nagios 3.x
Owner
Hits
138296
Meet The New Nagios Core Services Platform
Built on over 25 years of monitoring experience, the Nagios Core Services Platform provides insightful monitoring dashboards, time-saving monitoring wizards, and unmatched ease of use. Use it for free indefinitely.
Monitoring Made Magically Better
- Nagios Core on Overdrive
- Powerful Monitoring Dashboards
- Time-Saving Configuration Wizards
- Open Source Powered Monitoring On Steroids
- And So Much More!
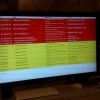
It parses the status.dat and gives you a dashboard for ex. viewing on a operations screen.
We forked Nagios Dashboard – PHP and gave it a new look, rewrote the code with ajax for our needs.
It parses the status.dat and gives you a dashboard for ex. viewing on a operations screen.
It parses the status.dat and gives you a dashboard for ex. viewing on a operations screen.
Reviews (3)
byHermke, May 7, 2013
It's a very nice tool you made here, but there aresome issues. After one day my /var filesystem was completely full, this was caused by the error.log file from apache2. I deleted it and than i watched with cat what was happening. Seems that there was some faulty code in your dashboard_get.php on lines 208 and 224. It gave an Undefined Offset 0 on the servicearray[servicecount] array. I fixed it by wrapping the two if blocks with another if-block like this : if(isset(servicearray[servicecount])){ //code
}
}
bysteffan, December 11, 2012
Hi,
First of all i want to say that i like this alot. i have been using it for about a year now, made some small changes myself but nothing big.
Some things do bother me:
1. Criticals are displayed before down hosts, then if the screen is not big enough, the down host gets hidden for us.
Would be better for us if down hosts always where on top.
2. If a host goes down, the critical services on that host also gets displayed on the screen, and then problem #1 happens. A options to filter services on a down host would be awesome.
Else this is a really great plugin/addon/whatever you want to call it.. and i like it alot! we have 2x24" monitors in the sealing connectet to a linux box that's displaying this in fullscreen :)
I want to thanks the one who uploadet/made this, for doing so. and i hope you will look over the two problems mentioned above, if you have the time. I tried myself, but my coding skills are not good enough :(


 New Listings
