Search Exchange
Search All Sites
Nagios Live Webinars
Let our experts show you how Nagios can help your organization.Login
Directory Tree
Nagios StatView
Current Version
2.0
Last Release Date
2011-10-19
Compatible With
- Nagios 3.x
Owner
Website
License
GPL
Hits
97743
Files:
| File | Description |
|---|---|
| readme.txt | Read me file |
| statview.cgi | The cgi file |
Meet The New Nagios Core Services Platform
Built on over 25 years of monitoring experience, the Nagios Core Services Platform provides insightful monitoring dashboards, time-saving monitoring wizards, and unmatched ease of use. Use it for free indefinitely.
Monitoring Made Magically Better
- Nagios Core on Overdrive
- Powerful Monitoring Dashboards
- Time-Saving Configuration Wizards
- Open Source Powered Monitoring On Steroids
- And So Much More!
It is designed for TV monitors of 32-40? and to give a quick health status of the network.
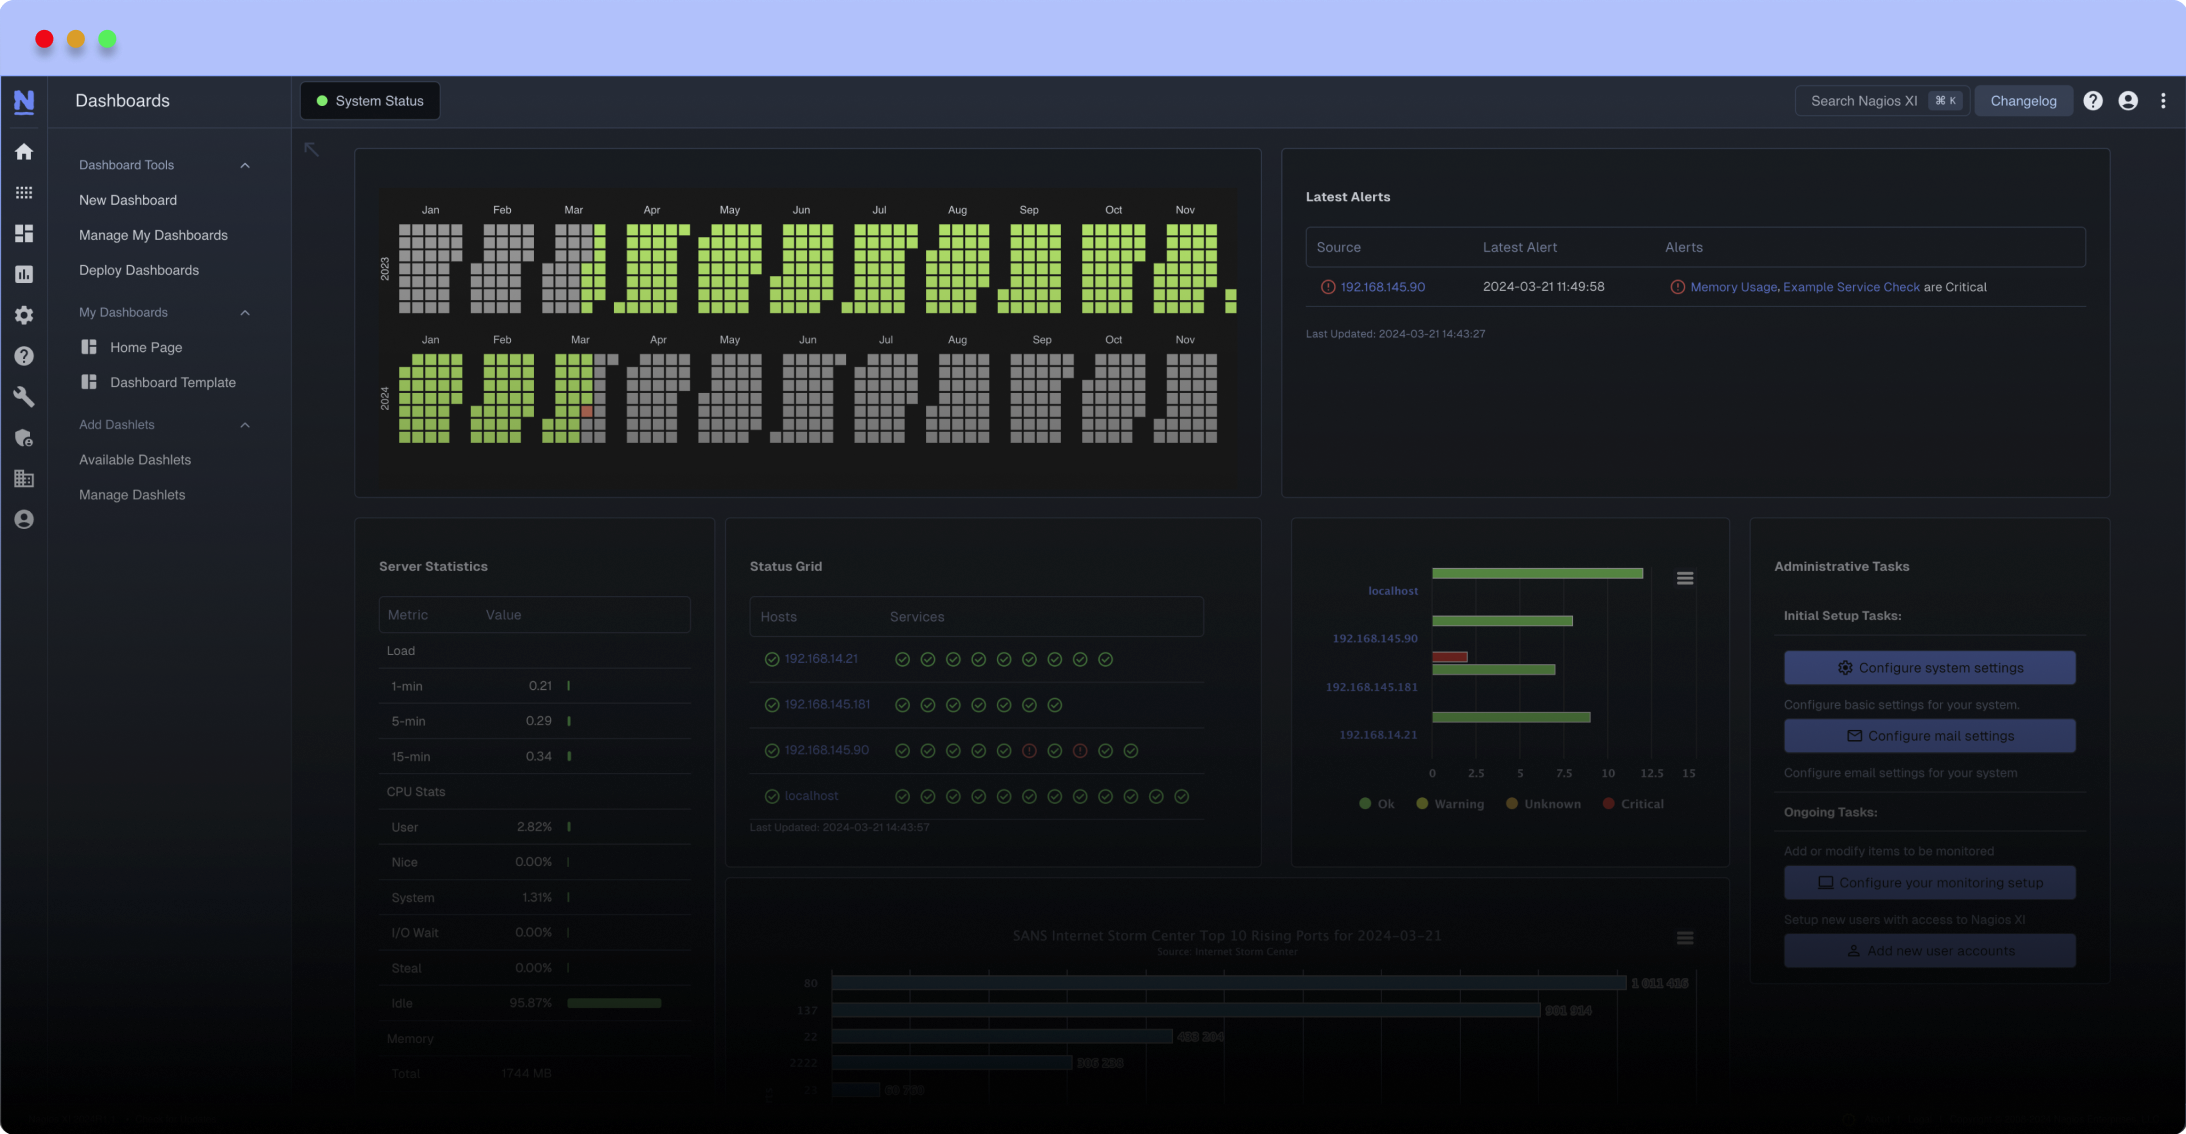
Nagios StatView is a dashboard for Nagios.
It is designed for TV monitors of 32-40" and to give a quick health status of the network.
You can fine tune the width of the display in pixels to match your screen resolution.
To make the screen more readable StatView have two aggregation levels, one based on groups and one based on servers.
If more than x services and hosts for this service group / server group is having problems StatView display?s one line for all errors to make it more readable,
And to make it more interesting I have added a daily comic strip at the bottom.
Installation:
Copy the file statview.cgi to your Nagios sbin folder, typical ?/usr/local/nagios/sbin? and make the file executable (chmod 755 nstatview.cgi)
Open statview.cgi and edit the configurable variables to suite your environment.
indata = Name and path to Nagios status file
hostgroups = Name and path to hostgroup file
groupcount = How many error and warning is needed before generating a group error
hostcount = How many error and warning is needed before generating a host error
pagewidth = Page width
dilbert = Path to Dilbert dir ("" gives no picture)
Test the page with ../nagios/cgi-bin/statview.cgi
To get the Dilbert images I used Dilbert Tools (fetch-dilbert) you can get it at: http://code.google.com/p/dilbert-tools/
Reviews (0)
Be the first to review this listing!


 New Listings
