Search Exchange
Search All Sites
Nagios Live Webinars
Let our experts show you how Nagios can help your organization.Login
Directory Tree
Directory
willemdh
Nagios XI Featured
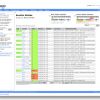 Nagios XI is Nagios Enterprises' official professional version of Nagios that is designed to make problematic IT monitoring tasks simple, while retaining the powerful attributes of its enterprise-class foundation blocks.
Designed for scalability and fl ...
NCPA Featured
 NCPA is a cross-platform monitoring agent that runs on Windows, Linux/Unix, and Mac OS/X machines. Its features include both active and passive checks, remote management, and a local monitoring interface.
NRDP - Nagios Remote Data Processor Featured
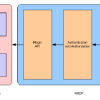 Nagios Remote Data Processor (NDRP) is a flexible data transport mechanism and processor for Nagios. It is designed with a simple and powerful architecture that allows for it to be easily extended and customized to fit individual users' needs. It uses st ...
NSClient
 NSClient++ is a monitoring agent/daemon for Windows systems that works with Nagios. It is a replacement for NSClient and NRPE_NT.
check_cpu.sh
This shell script checks cpu utilization (user,system,iowait,idle in %) with iostat accepting seperate threshholds and returning the data in a format suitable for performance data processing
check_multi
 check_multi is a multi purpose swiss knife plugin.
It calls multiple child plugins and displays their output in the long_plugin_output. A summary is given in the standard plugin output. The child return code with the highest severity becomes the parent ...
check_cpu_stats.sh
Nagios plugin (script) to check CPU Utilization Statistics (user,system,iowait,idle,nice and steal %) with iostat external program
Google Map Nagios XI Dashlet
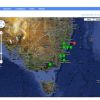 This dashlet is intended to be paired with the XI Google Map component. It allows the insertion of the Google Map tool into a dashlet to display host status as a map overlay. This dashlet requires Nagios XI 1.2C or later, as well as the XI Google Map co ...
check_emc_clariion.pl maintained by BuddhaBob74
 This plugin allows you to monitor an EMC CLARiiON SAN.
You can monitor the following components of the SAN:
* Storage Processors = Status of each SP
* Storage Processors Information = Gets information on the SP (SP ID, Agent Revision, FLARE Revision, ...
Check Microsoft Windows Scheduled Tasks
 Checks Microsoft Windows 2008 or higher enabled scheduled tasks excluding or including defined folders, task patterns and authors, returning state of tasks with name, author, exit code, last runtime and performance data to Nagios.
Text Dashlet Enhanced
 This Dashlet allows you to add text to a dashlet and format the style of the text. You can define up to three seperate sections of text and format each section with different styles. If you do not like the pre-defined style options you can also choose to ...
Check MSSQL Database Stats
One of two check plugins written in Python exclusively for MSSQL. Works with SQL Server 2000, 2005 and 2008. Designed for easy installation and easy upgradability.
check_snmp_brocade - monitor Brocade fibre channel swit...
check_snmp_brocade is a Nagios plugin to monitor the status of a single fc-port on a Brocade (labeled or original) fibre-channel switch. It is (in my opinion) the most complete plugin for brocades. I needs the MIBs from Brocade.By Martin Fuerstenau
Check for unexpected reboot
check_unexpected_reboot.cmd is a Windows cmd script that checks for a reboot after a crash or power outage of a Windows machine.
Powershell Disk Check & Automated Cleanup script
You'll need a proxy host to run your Powershell commands (or they can be run directly from the server(s)). More info here: http://www.nsclient.org/nscp/discussion/topic/637 This script will detect and monitor any fixed disks, the three variables you n ...
Check Active Directory Accounts
Check for Active Directory Accounts using powershell through NRPE / nsclient++: -Account Disabled -Account Expired -Account Expiring -Account Inactive -Locked Out -Password Expired -Password Never Expires Provide performance data to have graph ...
Plugin Tool
 This Component allows you to test Plugins and Commands. When you upload a plugin to your Nagios XI server you will usually want to test it first. This involves establishing an SSH session to the Nagios XI server and then typing some command line (CLI) st ...
Sam Weather 2.0
 Weather plugin for Nagios that lets you check temperature, humidity, wind, rain fall, dewpoint, heat index, windchill, pressure, solar radiation, and UV index. This also reports performance data to Nagios for graphing. The plugin uses data from Weather ...
Check Netapp Ontap
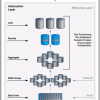 This Perl script is able to monitor most components of a NetApp Ontap cluster, such as volumes, aggregates,
snapshots, quotas, snapmirrors, filer hardware, ports, interfaces, cluster and disk health.
check_kms
![]() A plugin to check the status of how many licenses have been given by a KMS server.
A plugin to check the status of how many licenses have been given by a KMS server.
check_modbus
This is Nagios plugin for Modbus TCP and Modbus RTU using RS232/RS485. It can be used to monitor PLCs and any other industrial devices supported Modbus TCP or Modbus RTU.
Google Analytics Realtime
Get the current user count from google analytics realtime to your nagios monitoring system. Useful for websites and mobile apps.
check_memcache.py
(Nearly) drop-in replacement for check_memcache.php written in Python2.7
check_diskstat
![]() Linux disk IO check. Reads /sys filesystem directly to query tps, read, write, avg. request size, avg. queue size and avg. wait time.
Linux disk IO check. Reads /sys filesystem directly to query tps, read, write, avg. request size, avg. queue size and avg. wait time.
box293_check_vmware
This Plugin allows you to monitor a VMware vCenter / ESX(i) environment using your Nagios monitoring solution. IMPORTANT: This Plugin is NOT designed to be run on your Nagios host, instead it is offloaded to the VMware vSphere Management Assistant (vMA). ...
ModGearman Manager
 Use this component to manage your ModGearman Workers from a central location.
Check Microsoft Windows Disk Load
Check MS Windows disk load by using this Powershell script to get all disk load related counters from Windows Performance Manager, computing averages for all gathered samples and calculating read / write rate, number of reads / writes, read / write latenc ...
History Tab
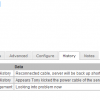 Adds a tab to Host and Service Detail screens to show history for comments, acknowledgements, downtime and external commands.
ServiceGroupServices
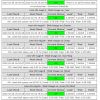 Simple dashlet that lets you choose a servicegroup and display the most recent perfdata in a table. To make this useful all the services in the servicegroup should be of the same category with the same type of perfdata.
#--Changes
#-- 1.0.0 - 2 ...
ITC HG SG Members
Quickly display Hostgroup and Servicegroup members. This does not show any status, but instead just shows the members. The is especially useful in large installations where hostgroup/servicegroup summary pages take forever to load and a non-admin just w ...
check_mem_ng.sh
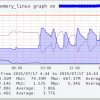 Compatible with Linux including RHEL 7+
This plugin is loosely inspired by check_mem v1.1 from Lukasz Gogolin
https://exchange.nagios.org/directory/Plugins/System-Metrics/Memory/check_mem-2Esh/details
I did a code rewrite and added a check of "free ...
Check Microsoft Windows Updates
Query number of pending WSUS updates and last successful update installation date on a Windows host and alert based on the amount of days the server had no updates.
Check Linux Process
Checks Linux process count, CPU and memory usage and produce relevant exit code and performance data to Nagios.
check_infoblox
 This is a plugin to monitor Infoblox appliances. It uses SNMP to retrieve the information from the appliance's management ip address. The plugin can also be used to measure and graph DNS resolving of domains.
check_jstat
A Nagios plugin to get memory statistics of a Java application using jstat
check_php
Check_php will check for PHP startup errors (-s), missing PHP modules (-m), misconfigured directives in php.ini (-c) and for available PHP updates (-u). This plugin supports performance data (error and warning counts over time) and long output (exact d ...
FireMotD
 Generate a dynamic MotD (Message of the Day) which displays system information after logging into a Linux server.. For example IP, Release, Kernel, Platform, Uptime, CPU Utilisation and Load, Memory, Swap, Disk information, the number of yum / apt-get / z ...
check_domain.php
A Nagios plugin for checking a domain expiration date by registry name. The major changes made from the shell version is that registry expiration dates have different date formats and keys. This version accepts a wide variety of Registry formats and i ...
Check Microsoft IIS Application Pool
![]() Checks Microsoft Windows IIS application pool state returning web application count, % CPU usage and memory usage.
Checks Microsoft Windows IIS application pool state returning web application count, % CPU usage and memory usage.
Status Info Dashlet
 This Dashlet allows you to select a service definition and display the current status information as a Dashlet. For example, you want to watch the free space check on a particular server (it's been fluctuating recently for no reason). This Dashlet allow ...
Check Wordpress Updates
Nagios plugin to check Wordpress website for core, plugin or theme updates and output the number of pending updates.
Unix/Linux Check Service Status
Linux/Unix shell script to check the status of a service. Capable of using sysvinit, systemd, upstart, etc, or choose your own status command. Tested on Ubuntu Linux, Fedora Linux, Red Hat Linux, FreeBSD, OSX, and AIX.
Check Docker
A plugin to check docker containers. Currently supports checking memory restarts status health-check results restarts uptime image version(experimental)
check_yum_last_update
This is a nagios plugin to check how long it has been since yum update was last run. It should be installed on each server you want to check and accessed via NRPE.
Nagios with InfluxDB, nagflux and Grafana
A short tutorial howto install InfluxDB, nagflux and Grafana.
SNMP UPS Check
Universal UPS check. Check for status of battery, temperature probes, voltage, load and much more! Based on the plugin by Daniel Dueñas Domingo, this adds quite a number of bugfixes, adds SNMP v3 support and improved code logic and flow.
Docker check
This is a Nagios plugin that monitors CPU / MEM / BANDWIDTH and status Docker.
Check WMI Plus
Many, many agentless Windows checks using WMI. No need for any software installs on Windows. Monitor Microsoft Windows systems directly from your Nagios server. Supports user configurable checks using an ini file - create your own WMI Queries. Check W ...
box293_check_message_queue
This Plugin is for checking the kernel message queues. Will return a critical result if more than 1 queue of the same owner exists. WARNING and/or CRITICAL thresholds can be defined on the number of message found in the queue. These need to be the second ...

 Directory
 New Listings