Search Exchange
Search All Sites
Nagios Live Webinars
Let our experts show you how Nagios can help your organization.Login
Directory Tree
Check CPU, Memory and UpTime with WMI
Current Version
1.3
Last Release Date
2012-08-20
Compatible With
- Nagios 3.x
Owner
Website
Download URL
Hits
71716
Files:
| File | Description |
|---|---|
| check_wmi_performance.sh | Check_WMI_Performance.sh |
Meet The New Nagios Core Services Platform
Built on over 25 years of monitoring experience, the Nagios Core Services Platform provides insightful monitoring dashboards, time-saving monitoring wizards, and unmatched ease of use. Use it for free indefinitely.
Monitoring Made Magically Better
- Nagios Core on Overdrive
- Powerful Monitoring Dashboards
- Time-Saving Configuration Wizards
- Open Source Powered Monitoring On Steroids
- And So Much More!
You can check CPU, Memory and Uptime without agent.
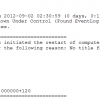
The UpTime mode, identify the shutdown modality: correct or unexpected.
define command{
command_name check_wmi_performance
command_line $USER1$/check_wmi_performance.sh -I $HOSTADDRESS$ -U $ARG1$ -P $ARG2$ -S $ARG3$ $ARG4$
}
UpTime check submit all information as:
- who
- when
- if unexpected
- report the shutdown or restart comment
- type
Reviews (0)
Be the first to review this listing!


 New Listings
