Search Exchange
Search All Sites
Nagios Live Webinars
Let our experts show you how Nagios can help your organization.Login
Directory Tree
Directory
ruddockr
byruddockr, February 4, 2014
the syntax of the line:
$users =`$lmpath lmstat -c $licsrv -a | grep -i $serv | wc -l`;
does NOT yield number of licenses served but just a line list containing $serv
(which is just the server name)
needs updated for newer lmgrd tools. maybe worked on an old lmutil version but not current ones (v9 or greater)
$users =`$lmpath lmstat -c $licsrv -a | grep -i $serv | wc -l`;
does NOT yield number of licenses served but just a line list containing $serv
(which is just the server name)
needs updated for newer lmgrd tools. maybe worked on an old lmutil version but not current ones (v9 or greater)
byruddockr, March 6, 2013
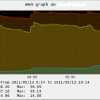
Great plugin - and yielding great info for nagiosgraph too!
Just one tweak that makes the graph more sensible to read.
default output is %idle which can be 100% all the time if a quiet server.
I changed this to return to CPU busy time (based on cpu_used variable)
code change snippett at line 120-126 (under check_cpu sub):
120 my $perfdata .= "|"
121 ."user=$cpu->{user}% "
122 ."system=$cpu->{system}% "
123 ."iowait=$cpu->{iowait}% "
124 ."InUse=$cpu_used%;$o_warning;$o_critical";
125
126 print "CPU $status : InUse $cpu_used% $perfdata";
Richard

 Directory
 New Listings
