Search Exchange
Search All Sites
Nagios Live Webinars
Let our experts show you how Nagios can help your organization.Login
Directory Tree
Nagios XI – Reporting & Graphing Series Tutorials – Performance Graphs & Graph Explorer
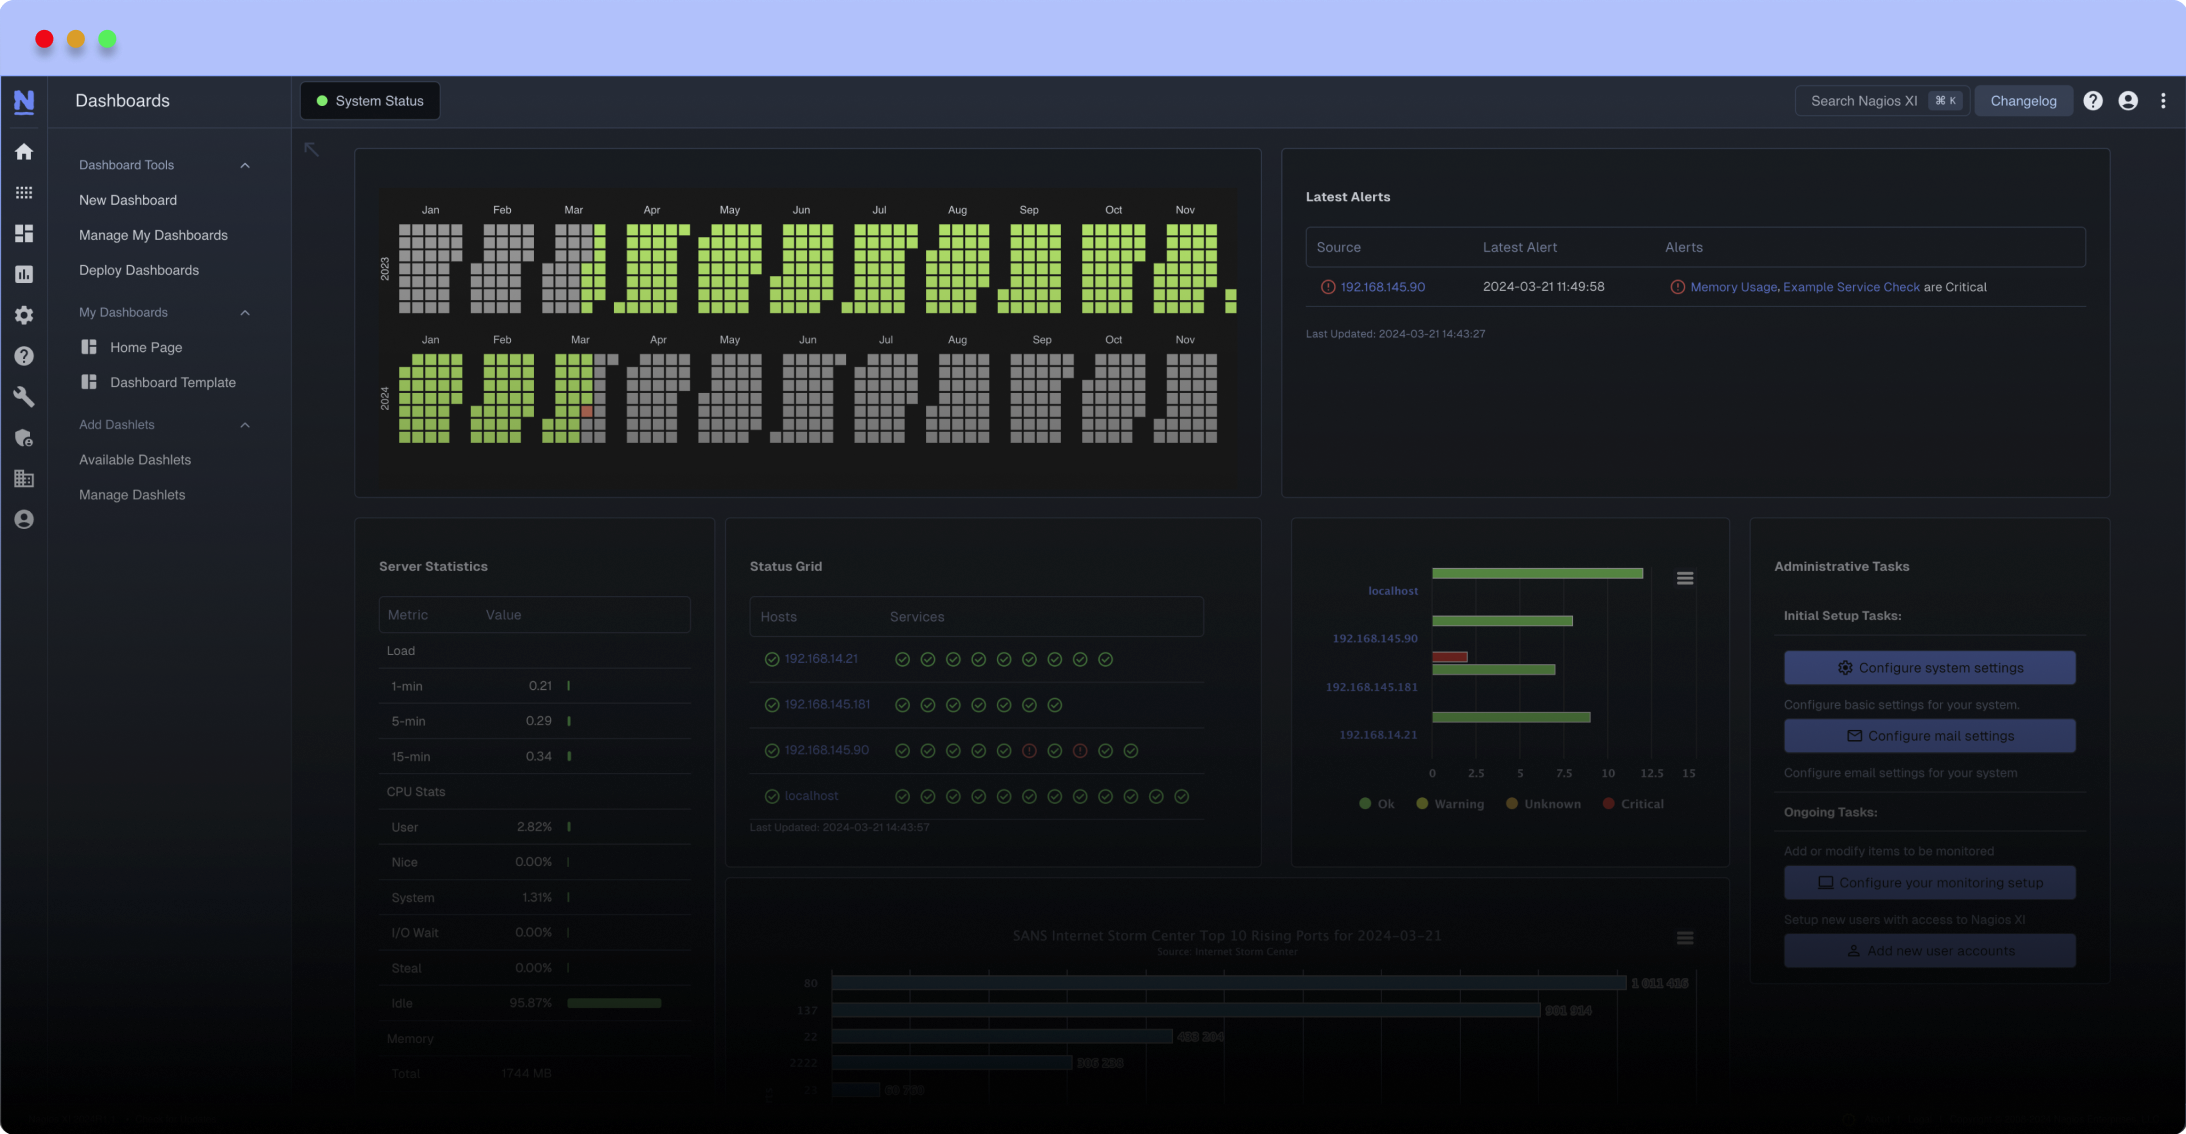
Meet The New Nagios Core Services Platform
Built on over 25 years of monitoring experience, the Nagios Core Services Platform provides insightful monitoring dashboards, time-saving monitoring wizards, and unmatched ease of use. Use it for free indefinitely.
Monitoring Made Magically Better
- Nagios Core on Overdrive
- Powerful Monitoring Dashboards
- Time-Saving Configuration Wizards
- Open Source Powered Monitoring On Steroids
- And So Much More!
Click here for the next video in the series.
Need to start at the beginning? Click here to start the series.
Nagios XI is powerful monitoring software that monitors all mission-critical infrastructure components in any environment. Whether you’re a sys admin at a startup, the CTO of a multi-billion dollar company or somewhere in between, the comprehensive features of Nagios XI can work for you.
Download XI: http://nag.is/xldd
Technical documentation: http://nag.is/xitd
User manuals: http://nag.is/xiud
Support Forum: http://nag.is/nsf
Learn More About Nagios XI: http://bit.ly/mIEcx0
Nagios homepage: https://www.nagios.com
Reviews (0)
Be the first to review this listing!


 New Listings