Search Exchange
Search All Sites
Nagios Live Webinars
Let our experts show you how Nagios can help your organization.Login
Directory Tree
Category: Dashboards
Nagios Log Server users can create custom dashboards which can be shared with other Log server users in this category
Meet The New Nagios Core Services Platform
Built on over 25 years of monitoring experience, the Nagios Core Services Platform provides insightful monitoring dashboards, time-saving monitoring wizards, and unmatched ease of use. Use it for free indefinitely.
Monitoring Made Magically Better
- Nagios Core on Overdrive
- Powerful Monitoring Dashboards
- Time-Saving Configuration Wizards
- Open Source Powered Monitoring On Steroids
- And So Much More!
Submit Your Nagios Project!
Help build Nagios Exchange for yourself and the entire the Nagios Community by your Nagios project to the site. It's easy - just create an account, login, and add a new listing. Read the FAQ for instructions.AD Lockouts
Simple dashboard to show locked out accounts, use the query to alert happy valentines day love from Australia
Asterisk Log Analyzer
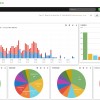 Parses Asterisk log files and splits fields into new "asterisk_" prefixed terms. Dashboard shows number of simultaneous inbound and outbound calls, top 10 producers of calls, top 10 inbound numbers being dialed, top 10 outbound numbers being dialed, sour ...
Better Apache Dashboard
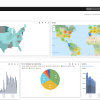 The "Better Apache Dashboard" also know as the 5 minute dashboard as presented at the 2014 Nagios World Conference.
View the conference slides at
http://www.nagios.com/events/nagiosworldconference/northamerica/2014/speakers#Scott-Wilkerson
Cisco ASA VPN Monitoring
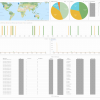 Dashboard that shows information about VPN sessions on Cisco ASA Devices.
DHCP Messages
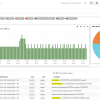 A custom dashboard to give a breakdown on the different DHCP Messages. This has a query filter where the type must be syslog and the program must be dhcpd.
Exchange 2010/2013 Message Tracking Logs
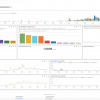 This dashboard monitors the Message Tracking Logs in Exchange 2010 onwards.
I can't take credit for developing this, I just adapted it for NLS - Original creator here: https://elijahpaul.co.uk/analysing-exchange-2013-message-tracking-logs-using-elk-ela ...
Exchange ActiveSync Monitor
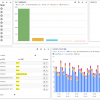 Gives overview of activesync connections, the types of commands being used and allows debugging poorly performing CAS servers which have high CPU usage for IIS
IIS Dashboard
 The IIS dashboard for nagios log server will allow you to visualize many different variations of response time compared to various metrics. Other informative details such as, most and least found instances of useragent, uri, and response code, provide a w ...
Mail Log Dashboard
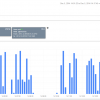 I have seen plenty of Nagios XI users, who would not receive alerts, because they haven't set up sendmail/postfix properly.
Searching the mail log for "bounced" errors may be helpful for identifying these issues.
My second query is for finding segf ...
McAfee Web Gateway Dashboard
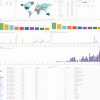 This dashboard allows you to easily see where your web traffic is going if you use McAfee Web Access gateways.
Nagios - Hosts
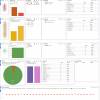 Break down of host states This dashboard relies on the Nagios Core input filter
Nagios - Notifications
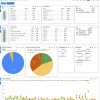 Break down of Nagios Notifications This dashboard relies on the Nagios Core input filter
Nagios - Services
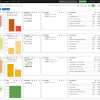 Break down of Service states This dashboard relies on the Nagios Core input filter
Nagios - Stats
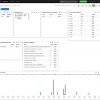 Statistical information about Nagios This dashboard relies on the Nagios Core input filter
Netfilter dashboard
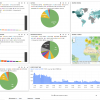 Dashboard and filter for parsing and displaying netfilter/iptables logs.
Security Dashboard
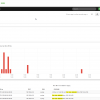 The security dashboard assumes /var/log/messages and /var/log/secure are being monitored. The associated query looks for things like "segfault" and "Failed password" and other things which may indicate an attack.
The second query looks for "Port scan ...
Simple Account Lockout Tracking Dash
This is a simple, clean dashboard with a pretty basic query. But it gives you relevant information for tracking down and identifying issues with users and account lockouts. Lockout events over time, top users that have been locked out, top sources of ...
Successful Windows Login Dashboard
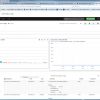 Successful Windows Login, is a Query that checks the logserver's log for EventID:4624 and that EventID is for when a user has logged in to their PC correctly.
VMWare Guest Power On is a Query that checks when a Guest VM running on a ESX server is power ...
syslog Types
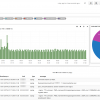 Simple Dashboard that has all the syslog types (0-7) pinned with a pie chart showing the breakdown. NOTE: The filter is configured to only show results that are of type:syslog.
Windows - Security Sys Admin Dashboards
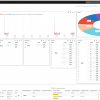 Dashboards used for Sys Admin Security monitoring and alerting.
TIP: Set up dashboard alerts, then you don't have to physical check all your dashboards.
Windows - Sys Admin Dashboards
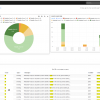 I use these dashboards to troubleshoot Windows issues and if no "customer" issues are present I can dig through the event logs and find issues that are not causing work stoppages (yet) and try to fix them ahead of time.
Windows Updates Dashboard
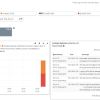 The following dashboard shows you how many total Windows Updates are
pending in the pipe, as well as the most recently installed updates. The
query filters for EventID 17 (pending) and 19 (installed). The dashboard
has two trimmed tables for the most r ...


 New Listings