Search Exchange
Search All Sites
Nagios Live Webinars
Let our experts show you how Nagios can help your organization.Login
Directory Tree
Windows Updates Dashboard
Compatible With
- Nagios Log Server
Owner
Hits
17307
Files:
| File | Description |
|---|---|
| Common_MSSQL_issues_errors.json | Common MSSQL Issues Query |
| Windows Updates-1417728155708 | Windows Updates Dashboard |
| Windows_Updates.json | Windows Updates Query |
Meet The New Nagios Core Services Platform
Built on over 25 years of monitoring experience, the Nagios Core Services Platform provides insightful monitoring dashboards, time-saving monitoring wizards, and unmatched ease of use. Use it for free indefinitely.
Monitoring Made Magically Better
- Nagios Core on Overdrive
- Powerful Monitoring Dashboards
- Time-Saving Configuration Wizards
- Open Source Powered Monitoring On Steroids
- And So Much More!
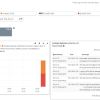
pending in the pipe, as well as the most recently installed updates. The
query filters for EventID 17 (pending) and 19 (installed). The dashboard
has two trimmed tables for the most relevant data, as well as two bar
charts to compare the two queries, a Pie chart on the bottom, as well as
a total count of both queries to the right of it.
Additionally, I've attached the second requested query, which checks
Windows Event Viewer for six of the top / most common MSSQL trouble
event ID's that I was able to find/read up on. Just for illustrations
sake I've also attached a screenshot of them in action in NLS, with as
many events as I could force.
Reviews (0)
Be the first to review this listing!


 New Listings
