Search Exchange
Search All Sites
Nagios Live Webinars
Let our experts show you how Nagios can help your organization.Login
Directory Tree
check-upsmib
Current Version
0.3
Last Release Date
2018-07-16
Compatible With
- Nagios 3.x
- Nagios 4.x
- Nagios XI
Owner
License
GPL
Hits
10563
Meet The New Nagios Core Services Platform
Built on over 25 years of monitoring experience, the Nagios Core Services Platform provides insightful monitoring dashboards, time-saving monitoring wizards, and unmatched ease of use. Use it for free indefinitely.
Monitoring Made Magically Better
- Nagios Core on Overdrive
- Powerful Monitoring Dashboards
- Time-Saving Configuration Wizards
- Open Source Powered Monitoring On Steroids
- And So Much More!
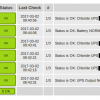
This plugin performs checks using SNMP version 1, 2c or 3.
Possible checks are:
- AlarmsPresent
- BatteryStatus
- BatteryTemperature
- EstimatedChargeRemaining
- EstimatedMinutesRemaining
- OutputSource
Each check type is performed separately, letting you adjust the critical and warning thresholds individually.
Each check also produces perf data for graphing purposes.
Example Usage:
check_upsmib -H 10.100.100.5 -C community -T AlarmsPresent
check_upsmib -H 10.100.100.5 -C community -T BatteryStatus
check_upsmib -H 10.100.100.5 -C community -T BatteryTemperature
check_upsmib -H 10.100.100.5 -C community -T EstimatedChargeRemaining
check_upsmib -H 10.100.100.5 -C community -T EstimatedMinutesRemaining
check_upsmib -H 10.100.100.5 -C community -T OutputSource
check_upsmib -H 10.1.1.10 -s 3 -u myusername -A mysecretpassword -T BatteryTemperature
Reviews (1)
Dear ... I am trying the plugin .. but how do I see the graphics ... Greetings from Peru ..
Owner's reply
It is nagios that generates the graphs so configuration of your installation of nagios is required. The plugin returns the information that nagios can then use to generate graphs.


 New Listings
