Search Exchange
Search All Sites
Nagios Live Webinars
Let our experts show you how Nagios can help your organization.Login
Directory Tree
Python Memory Check (psutil)
Current Version
1.0
Last Release Date
2015-10-06
Compatible With
- Nagios 4.x
Owner
Download URL
License
GPL
Hits
8102
Files:
| File | Description |
|---|---|
| README.TXT | README |
| mem_check.py | Python script to check memory use |
| check_nrpe_mem_mem_check.php | pnp4nagios template |
Meet The New Nagios Core Services Platform
Built on over 25 years of monitoring experience, the Nagios Core Services Platform provides insightful monitoring dashboards, time-saving monitoring wizards, and unmatched ease of use. Use it for free indefinitely.
Monitoring Made Magically Better
- Nagios Core on Overdrive
- Powerful Monitoring Dashboards
- Time-Saving Configuration Wizards
- Open Source Powered Monitoring On Steroids
- And So Much More!
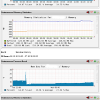
A Python based memory check which leverages psutil and nrpe to return % used, buffered, cached, and total used memory metrics.
The first graph tracks the % of system used memory, and will by default warn at 85% and crit at 95%. You can adjust these with the -C/-W options when executing the script if desired.
The second graph is for historical data only, no alerts will be sent for any cached, buffered or total used value, as they are not always indicative of a server issue. Having the data historically graphed should help Systems Administrators make better resource decisions when considering upgrading or removing resources from a server.
Installation details included in README file. pnp4nagios template is included.
Written in Python 2.7.x. All print statements are in the Python 3.x friendly format of print('data'), which should allow this to run in Python 2 or 3. Not yet tested in Python 3, it may take some tweaking to work.
Reviews (0)
Be the first to review this listing!


 New Listings
